NOAA Winter Outlook 2026-27December · January · February
The Climate Prediction Center issued its December-February outlook on October 15, 2026. Of the 45 cities we track, 28 lean warmer than normal and 27 lean wetter. The backdrop: El Niño Advisory.
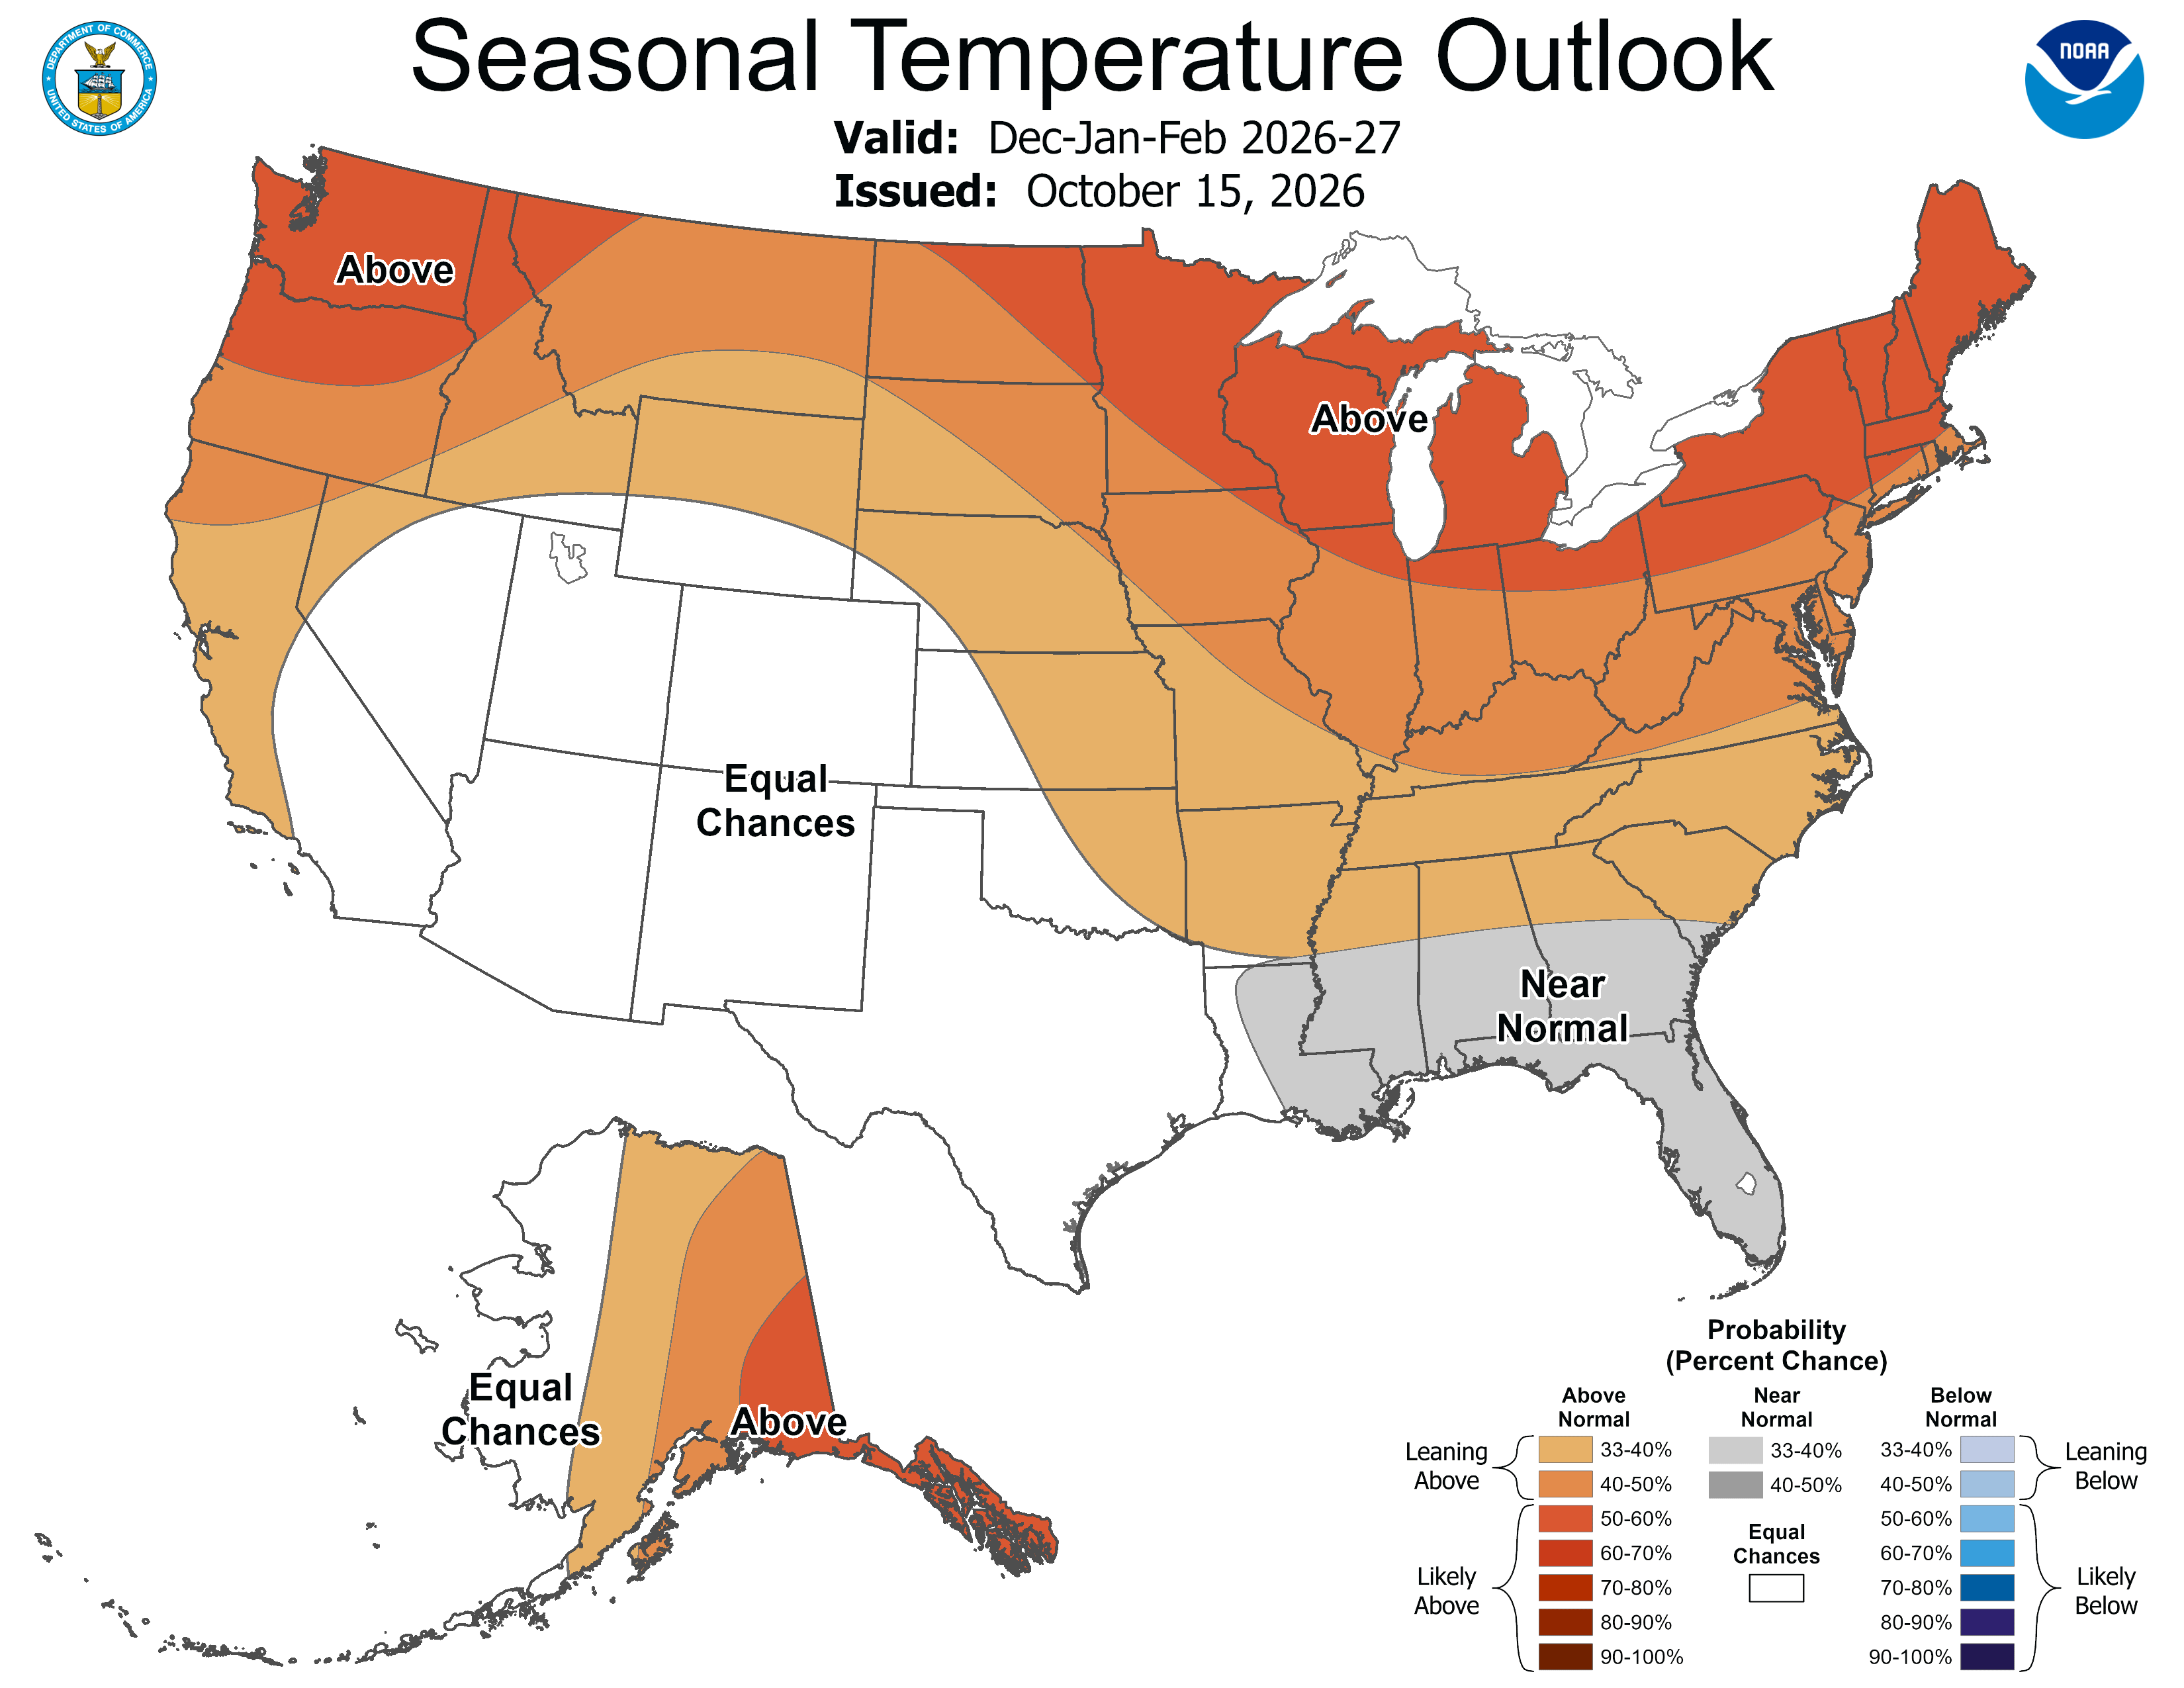
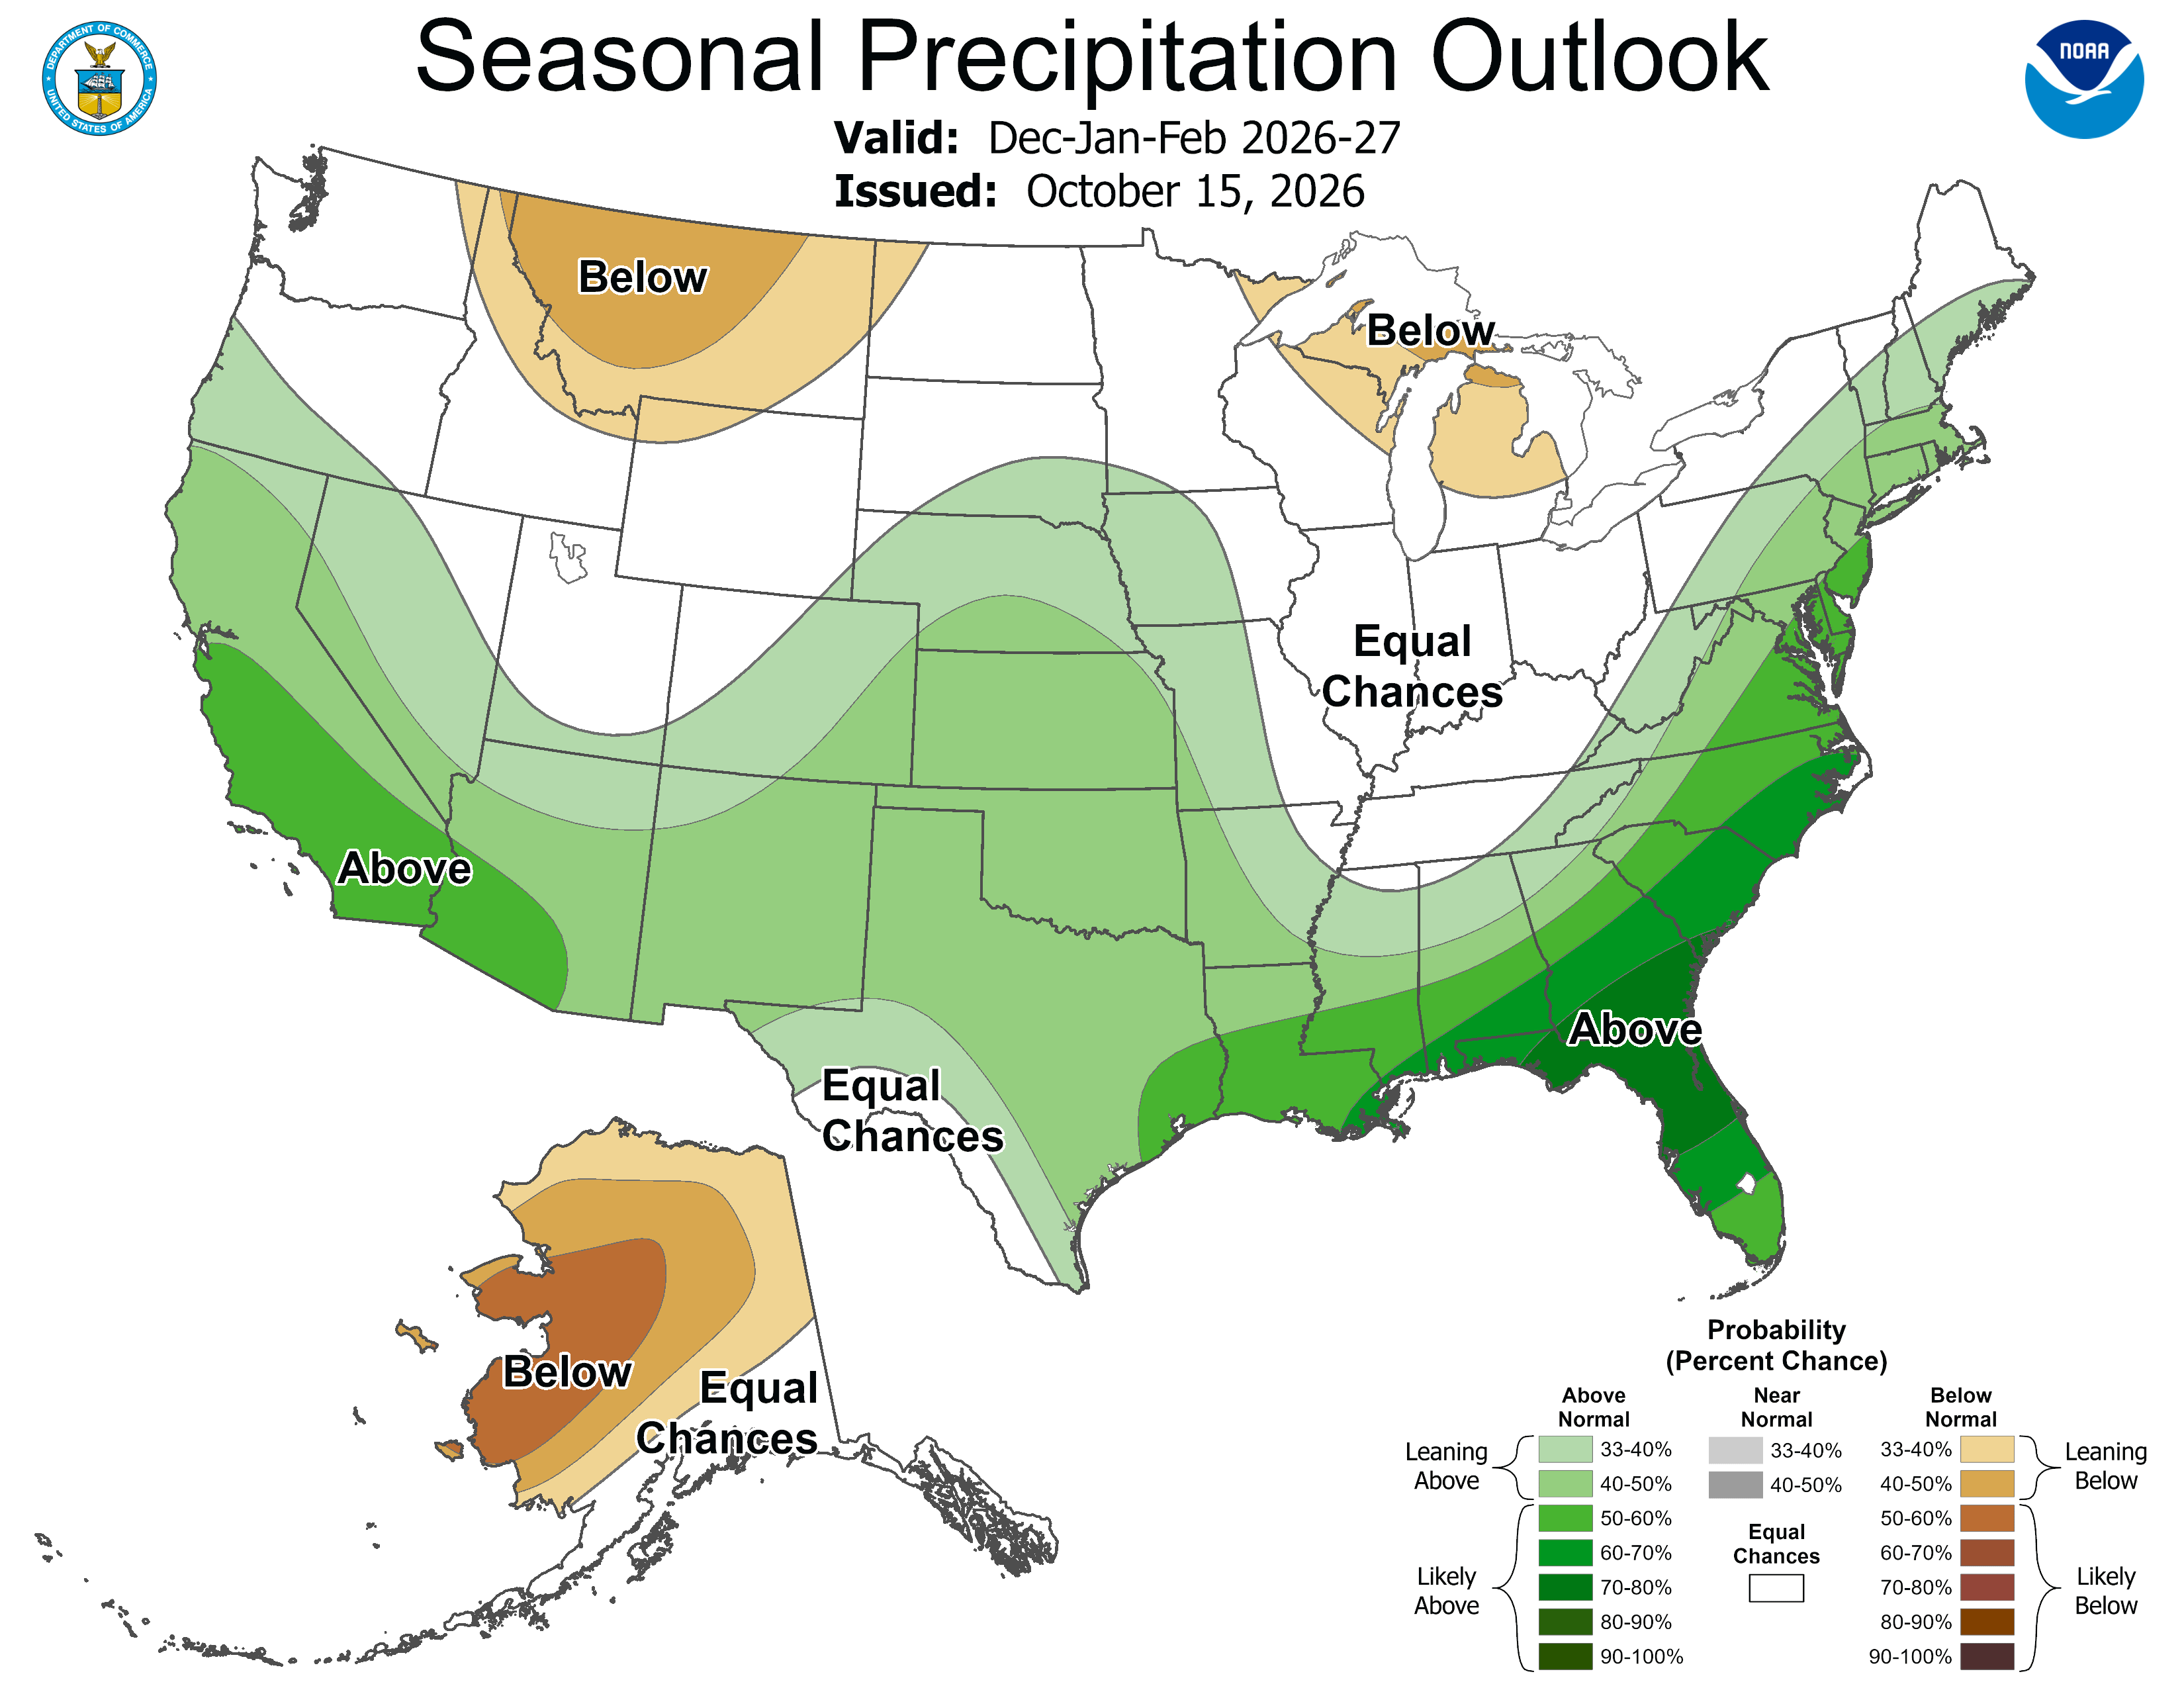
Both maps are the CPC’s official DJF 2026-2027 outlook (lead 2), redrawn by us from its GIS shapefiles. Colors show the most likely tercile and its probability; normals are 1991-2020.
Region by region
The most common call among the cities we track in each region, from the CPC shapefiles. Our reading, not the CPC’s words.
- Pacific Northwest: warmer than normal (up to 50–60 %); equal chances.
- California: warmer than normal (up to 33–40 %); wetter than normal (up to 50–60 %) (not every city agrees: see the table).
- Southwest: equal chances; wetter than normal (up to 50–60 %).
- Rockies & Intermountain West: warmer than normal (up to 40–50 %); equal chances (not every city agrees: see the table).
- Northern Plains: warmer than normal (up to 50–60 %); equal chances (not every city agrees: see the table).
- Southern Plains & Texas: equal chances; wetter than normal (up to 50–60 %).
- Midwest & Great Lakes: warmer than normal (up to 50–60 %); equal chances (not every city agrees: see the table).
- Ohio & Tennessee valleys: warmer than normal (up to 40–50 %); equal chances.
- Southeast: warmer than normal (up to 33–40 %); wetter than normal (up to 60–70 %) (not every city agrees: see the table).
- Florida: near normal (up to 33–40 %); wetter than normal (up to 70–80 %).
- Northeast & Mid-Atlantic: warmer than normal (up to 50–60 %); wetter than normal (up to 40–50 %) (not every city agrees: see the table).
- Alaska: warmer than normal (up to 50–60 %); equal chances (not every city agrees: see the table).
City by city
Most likely tercile and its probability band at each city (point-in-polygon on the CPC outlook; our math; for a coastal city outside the CPC coastline, the nearest land point within 0.25°).
| City | Temperature, Dec–Feb | Precipitation, Dec–Feb |
|---|---|---|
| Pacific Northwest | ||
| Seattle | Warmer · 50–60 % | Precip: equal chances |
| Portland | Warmer · 50–60 % | Precip: equal chances |
| Spokane | Warmer · 50–60 % | Precip: equal chances |
| California | ||
| San Francisco | Warmer · 33–40 % | Wetter · 40–50 % |
| Sacramento | Warmer · 33–40 % | Wetter · 40–50 % |
| Los Angeles | Temp: equal chances | Wetter · 50–60 % |
| San Diego | Temp: equal chances | Wetter · 50–60 % |
| Southwest | ||
| Phoenix | Temp: equal chances | Wetter · 50–60 % |
| Las Vegas | Temp: equal chances | Wetter · 40–50 % |
| Albuquerque | Temp: equal chances | Wetter · 40–50 % |
| El Paso | Temp: equal chances | Wetter · 40–50 % |
| Rockies & Intermountain West | ||
| Denver | Temp: equal chances | Wetter · 33–40 % |
| Salt Lake City | Temp: equal chances | Precip: equal chances |
| Boise | Warmer · 40–50 % | Precip: equal chances |
| Billings | Warmer · 33–40 % | Drier · 33–40 % |
| Northern Plains | ||
| Bismarck | Warmer · 40–50 % | Precip: equal chances |
| Sioux Falls | Warmer · 40–50 % | Wetter · 33–40 % |
| Minneapolis | Warmer · 50–60 % | Precip: equal chances |
| Southern Plains & Texas | ||
| Oklahoma City | Temp: equal chances | Wetter · 40–50 % |
| Dallas | Temp: equal chances | Wetter · 40–50 % |
| Houston | Temp: equal chances | Wetter · 50–60 % |
| San Antonio | Temp: equal chances | Wetter · 40–50 % |
| Midwest & Great Lakes | ||
| Chicago | Warmer · 50–60 % | Precip: equal chances |
| Detroit | Warmer · 50–60 % | Precip: equal chances |
| Kansas City | Warmer · 33–40 % | Wetter · 33–40 % |
| St. Louis | Warmer · 40–50 % | Precip: equal chances |
| Ohio & Tennessee valleys | ||
| Cincinnati | Warmer · 40–50 % | Precip: equal chances |
| Louisville | Warmer · 40–50 % | Precip: equal chances |
| Nashville | Warmer · 33–40 % | Precip: equal chances |
| Southeast | ||
| Atlanta | Warmer · 33–40 % | Wetter · 40–50 % |
| Charlotte | Warmer · 33–40 % | Wetter · 50–60 % |
| New Orleans | Near normal · 33–40 % | Wetter · 60–70 % |
| Birmingham | Warmer · 33–40 % | Wetter · 33–40 % |
| Florida | ||
| Jacksonville | Near normal · 33–40 % | Wetter · 70–80 % |
| Orlando | Near normal · 33–40 % | Wetter · 70–80 % |
| Tampa | Near normal · 33–40 % | Wetter · 70–80 % |
| Miami | Near normal · 33–40 % | Wetter · 50–60 % |
| Northeast & Mid-Atlantic | ||
| Washington, D.C. | Warmer · 40–50 % | Wetter · 40–50 % |
| Philadelphia | Warmer · 40–50 % | Wetter · 40–50 % |
| New York | Warmer · 40–50 % | Wetter · 40–50 % |
| Boston | Warmer · 50–60 % | Wetter · 40–50 % |
| Burlington | Warmer · 50–60 % | Precip: equal chances |
| Alaska | ||
| Anchorage | Warmer · 40–50 % | Precip: equal chances |
| Fairbanks | Warmer · 40–50 % | Drier · 40–50 % |
| Juneau | Warmer · 50–60 % | Precip: equal chances |
El Niño, the main driver
NOAA’s latest ENSO status and synopsis, quoted as published.
El Niño continues to strengthen, with a strong-to-very strong El Niño likely through January-March 2027 (remaining greater than an 83% chance).
CPC prognostic discussion, summary for non-technical users (it describes Nov-Jan, the first season of the set), quoted as issued · 830 AM EDT Thu Oct 15 2026
The ongoing El Nino event continues to strengthen, and an El Nino advisory remains in effect and is favored to continue through Spring 2027. The seasonal outlooks for the upcoming winter and spring are heavily influenced by this very strong event. The Temperature Outlook for Nov-Dec-Jan (NDJ) 2026-2027 favors above-normal seasonal mean temperatures for eastern Alaska, the northern tier and western third of the contiguous U.S. (CONUS), south Florida, and the Ohio Valley and mid-Atlantic regions. The highest odds of warmer than normal conditions are located over Southeast Alaska, the upper Mississippi Valley and Great Lakes. Near-normal seasonal average temperatures are favored for much of the Southeast. There is an elevated likelihood of above-normal seasonal precipitation amounts for much of California, the Southwest, the Central and Southern Plains, the Lower Mississippi Valley, the Southeast and along the eastern seaboard. The greatest likelihood for wetter than normal conditions is forecast for the Southeast and Florida. Below-normal precipitation is favored for much of interior Alaska, the Northern Rockies and High Plains, and parts of the Great lakes region. Equal chances (EC, white areas) are forecast for areas where probabilities for each category of seasonal mean temperatures and accumulated precipitation amounts are forecast to be similar to climatological probabilities.
DJF: The evolution of the Temperature Outlooks from Dec-Jan-Feb (DJF) 2026-2027 through MAM 2027 maintain the NDJ forecast pattern in large order and are consistent with strong El Nino events through these seasons with additional attention paid to some of the historically strong events.
What NOAA said
From NOAA’s news release of October 15, 2026, summarized by us.
- Warmer than average favored: northern California, the Pacific Northwest, the Midwest, the Mississippi Valley, much of the East, Alaska, Puerto Rico and the U.S. Virgin Islands.
- Near-normal temperatures favored in parts of the Southeast, including Florida; equal chances in Hawaii and much of the Southwest.
- Wetter than average favored across the southern tier, from the Southwest to the Southeast, and along the East Coast.
- Drier than average favored in Hawaii, much of Alaska, the northern Mountain West, some Great Lakes areas and the western Pacific islands.
- Drought expected to improve or end in the Southwest, the southern Great Plains, the Southeast and parts of the East Coast; to develop or worsen in parts of the northern Rockies, northeastern Oregon and eastern Washington.
“Now is the time for communities and individuals to plan ahead.” Ken Graham, director of NOAA's National Weather Service
The official CPC maps
As published by the Climate Prediction Center for this season (copies, unchanged).
Quick questions
What will winter 2026-2027 be like, according to NOAA?
The Climate Prediction Center's December-February outlook, issued October 15, 2026, tilts the odds like this in a few cities: Seattle, warmer than normal, equal chances; Los Angeles, equal chances, wetter than normal; Chicago, warmer than normal, equal chances; New York, warmer than normal, wetter than normal; Atlanta, warmer than normal, wetter than normal; Miami, near normal, wetter than normal. These are probabilities, not certainties.
What does El Niño have to do with it?
The CPC's ENSO status is “El Niño Advisory” (8 October 2026). In its discussion the CPC says this very strong El Niño is the main driver of its winter and spring outlooks.
Does the outlook say how much snow will fall?
No. CPC seasonal outlooks give the odds of seasonal mean temperature and total precipitation landing above, near or below normal (1991-2020). They do not forecast snowfall totals or individual storms.
What does “equal chances” mean?
That the CPC sees no reason to tilt the odds: each of the three terciles (above, near or below normal) keeps its climatological 33% chance.
When is it updated?
The CPC issues a new set every month, on the third Thursday. The next one is due November 19, 2026. This page rebuilds itself with every new set.